
Average True Range (ATR)
Average True Range (ATR) estimates how much an instrument has been moving. It measures volatility, not direction: a rising ATR can occur while price rises or falls.
Average True Range (ATR) estimates how much an instrument has been moving. It measures volatility, not direction: a rising ATR can occur while price rises or falls.
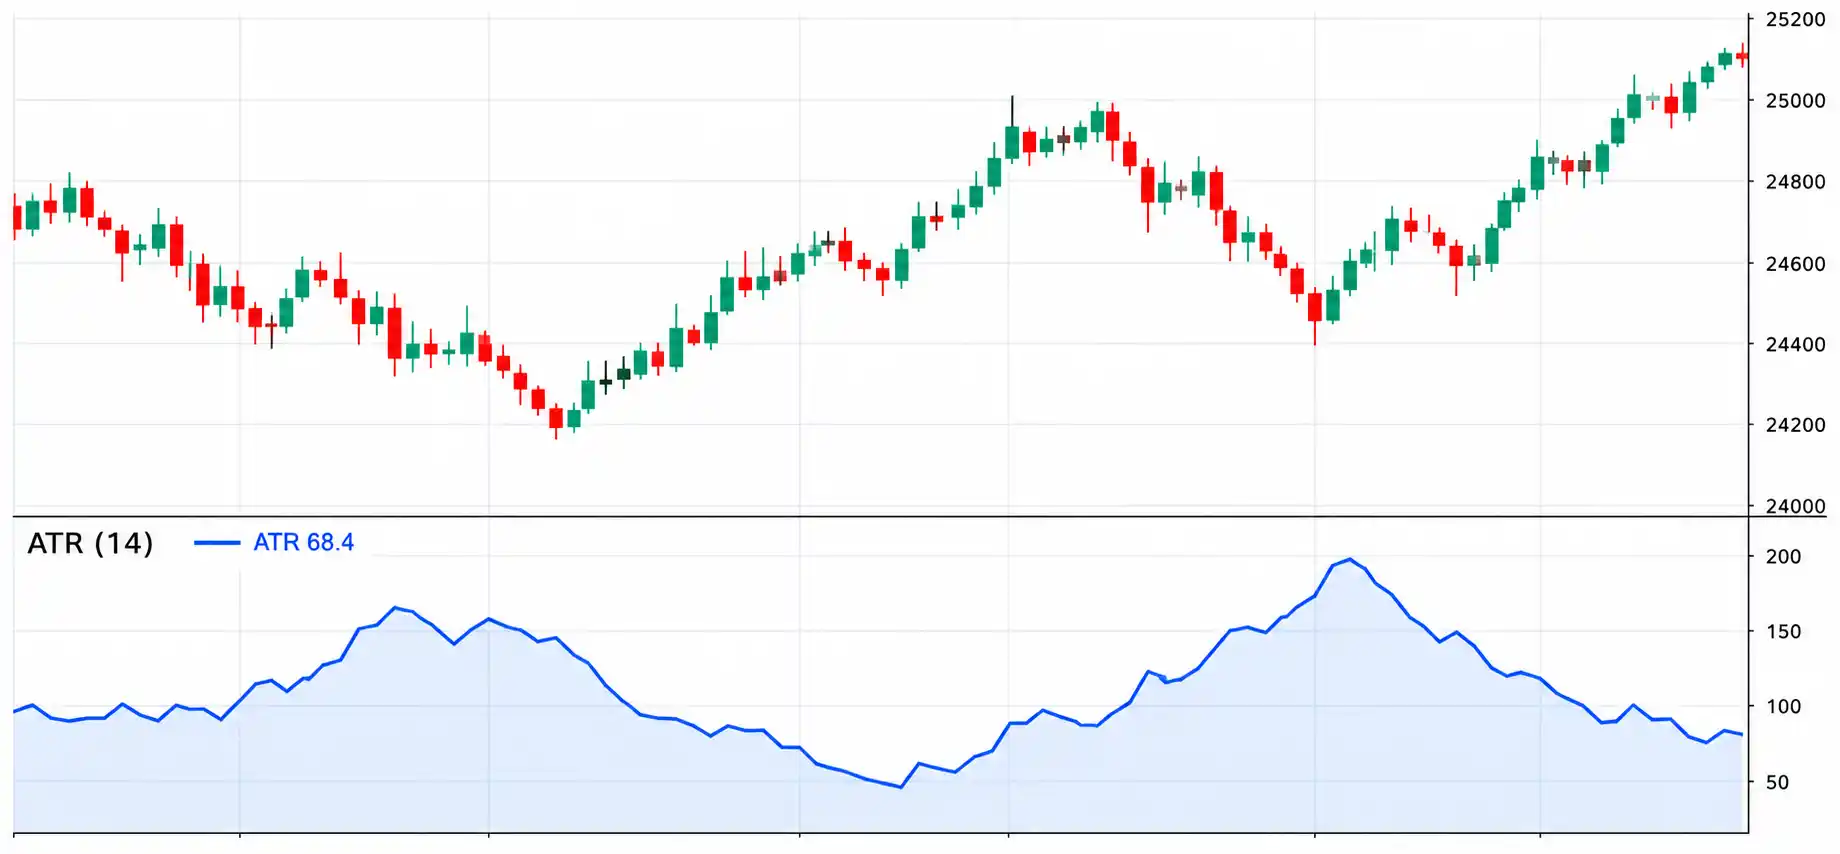
What it measures
True Range uses the largest of the current high-to-low distance, the distance from the previous close to today’s high, and the distance from the previous close to today’s low. ATR smooths those true ranges over a chosen period; 14 is a common default.
A short history
J. Welles Wilder Jr. introduced ATR in his 1978 book, New Concepts in Technical Trading Systems. It was designed to account for gaps as well as the high-to-low range when describing market movement. Wilder’s 1978 book record
How traders use it
- Compare recent movement size across time periods for the same instrument.
- Build volatility-aware examples for stop distance or position-size calculations.
- Notice when volatility expands or contracts; ATR does not show which direction price may move.
Using ATR to plan risk, not direction
This is a study framework for learning and backtesting, not a trade recommendation.
- Choose an entry idea and a separate price level that would invalidate it. ATR cannot choose the direction or prove that the setup is sound.
- For a learning example, compare the stop distance with a multiple of ATR, such as 1.5 or 2 times ATR. This is only a testable convention, not a recommended setting.
- A simple quantity estimate is planned cash risk divided by the distance from entry to the planned exit. Include costs and remember that gaps can make actual losses larger.
Common mistakes and limits
- A high ATR does not mean price is bullish, and a low ATR does not mean a breakout is due.
- ATR changes as volatility changes; a fixed stop distance may not fit every period.
- A calculated stop is not a guarantee of execution at that price.
Indicators are based on past data and can give late or false signals. The examples on this page are educational, not current market signals or personal financial advice. Trading involves risk, including the possible loss of capital.
Frequently asked questions
Does ATR tell me whether to buy or sell?
No. ATR measures recent movement size. It contains no built-in bullish or bearish direction.
What does 14-period ATR mean?
It is an average of true range values across a 14-bar window using the platform’s smoothing method. The meaning of a bar depends on the chart timeframe.