
Supertrend
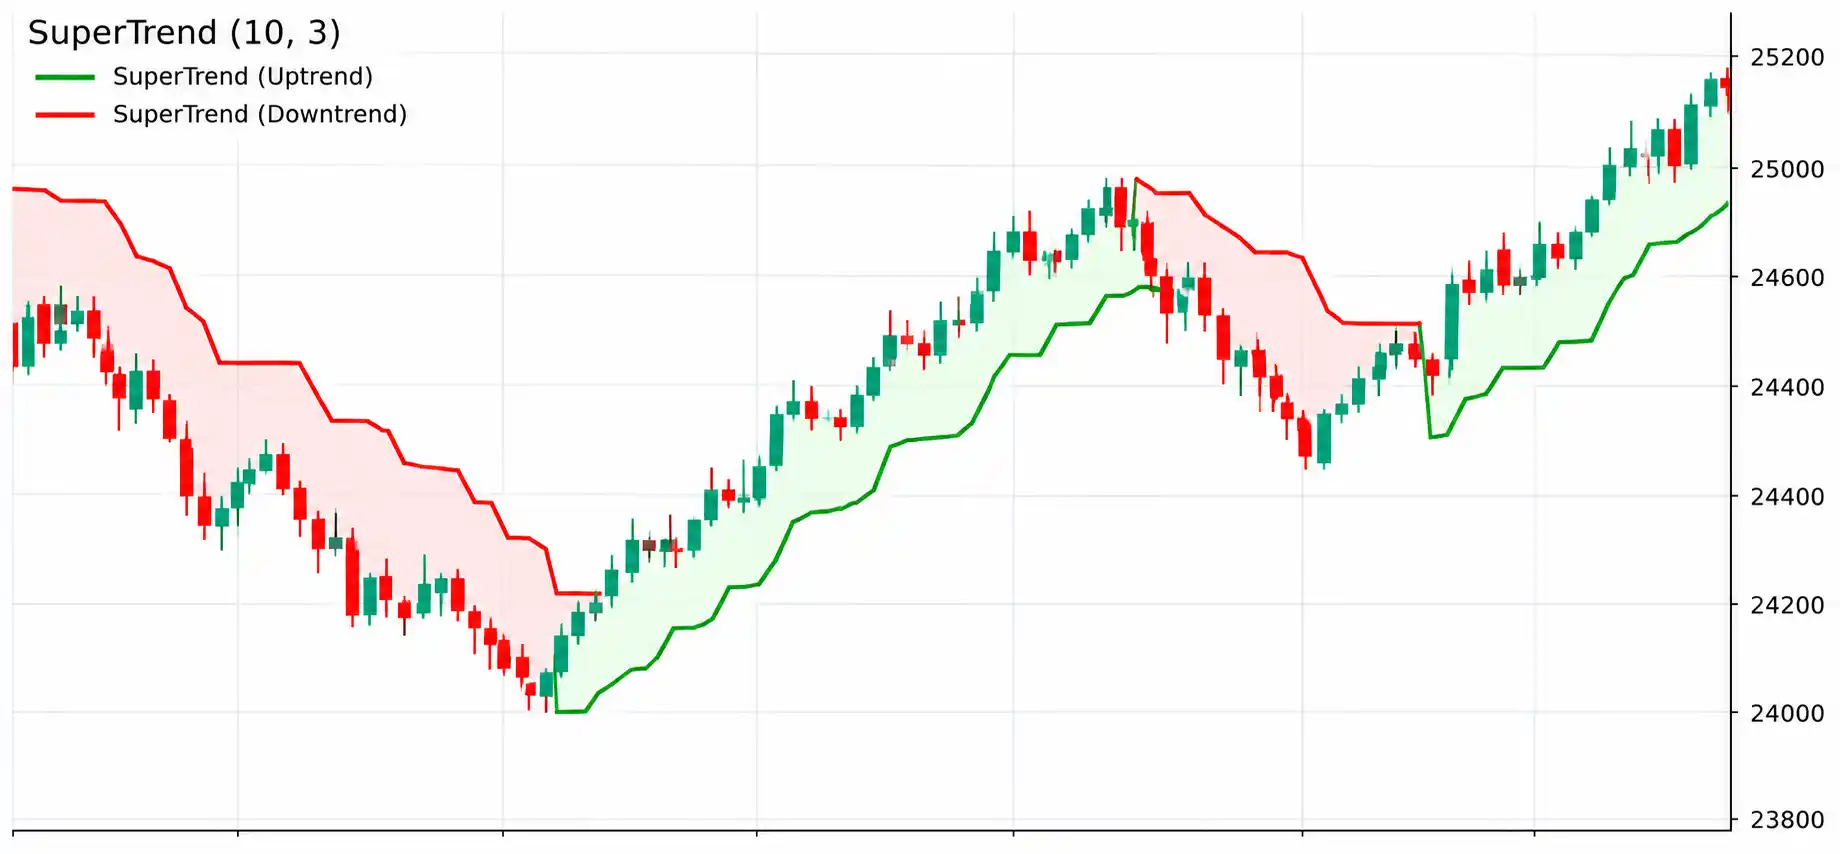
Supertrend is a chart overlay that places a volatility-based line above or below price. Its colour or side can help show the direction of its current rule, but it can change repeatedly in choppy markets.
Supertrend is a chart overlay that places a volatility-based line above or below price. Its colour or side can help show the direction of its current rule, but it can change repeatedly in choppy markets.
What it measures
Most versions use Average True Range (ATR) to set a distance from price. When price crosses the calculated line, the line switches sides and the displayed trend direction may flip. Period and multiplier settings vary by platform.
A short history
Supertrend is commonly credited to French trader and author Olivier Seban. It became widely available through charting platforms. Unlike RSI and ATR, its history is not usually tied to one widely cited original technical paper or standard setting. TradingView: Supertrend background
How traders use it
- Keep a visible, rule-based reference line on a chart.
- Study possible trend continuation or a change in direction after a line flip.
- Use it as one input for reviewing an exit plan, while allowing for gaps and imperfect execution.
A filtered Supertrend study
This is a study framework for learning and backtesting, not a trade recommendation.
- Set the Supertrend period and multiplier before testing; chart platforms may calculate details differently.
- Study a bullish flip only when broader price structure also points upward, or a bearish flip when it points downward. A longer average can be used as a simple context filter.
- Define the price or condition that would invalidate the idea and plan the maximum loss. Test across trending and sideways periods.
Common mistakes and limits
- Repeated flips can create losses and costs in sideways markets.
- The line is calculated from past prices and volatility, so a signal can arrive late.
- Do not assume that the line will be the exact price where a stop order is filled.
Indicators are based on past data and can give late or false signals. The examples on this page are educational, not current market signals or personal financial advice. Trading involves risk, including the possible loss of capital.
Frequently asked questions
Is Supertrend a buy-or-sell signal?
It can mark a rule-based direction change on a chart, but it can whipsaw and does not predict future price.
Do all chart platforms calculate it the same way?
Settings and implementation can differ. Check the platform’s formula and test the exact version you plan to study.