
Relative Strength Index (RSI)
The Relative Strength Index (RSI) compares recent upward and downward price moves. It gives a reading from 0 to 100 and helps describe momentum; it does not predict what price must do next.
The Relative Strength Index (RSI) compares recent upward and downward price moves. It gives a reading from 0 to 100 and helps describe momentum; it does not predict what price must do next.
What it measures
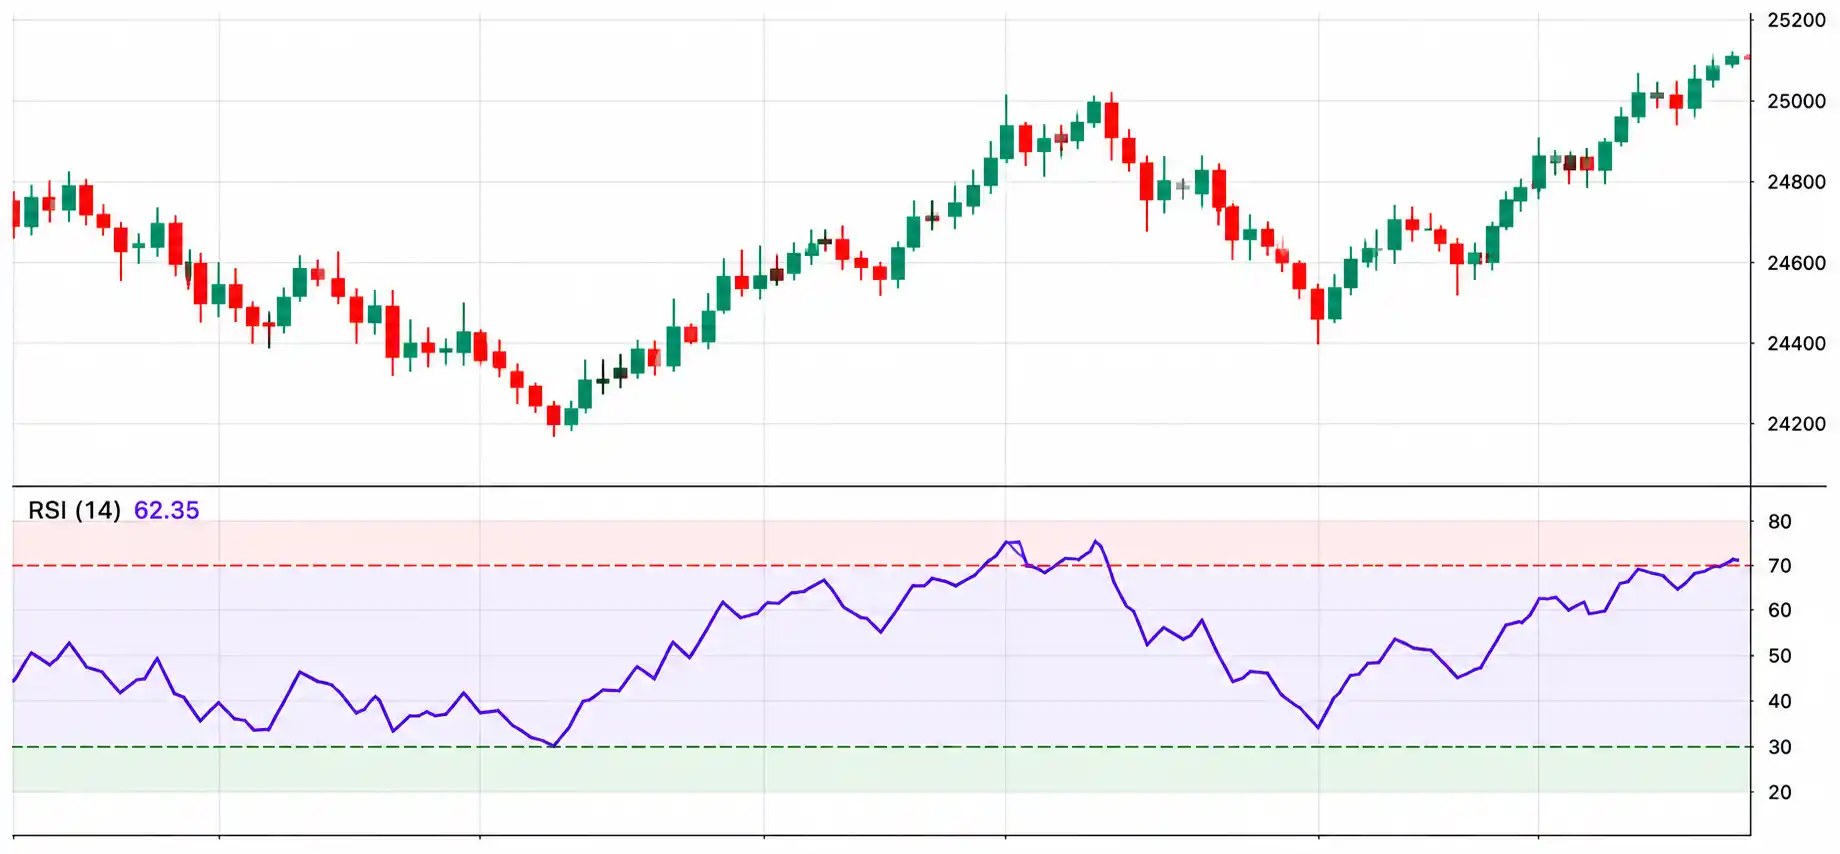
RSI smooths recent gains and losses over a chosen number of bars. Many charts start with 14 periods. A higher reading means recent gains were stronger than recent losses over that window; it does not mean a share is objectively expensive.
A short history
Market technician J. Welles Wilder Jr. introduced RSI in his 1978 book, New Concepts in Technical Trading Systems. The book presented RSI alongside several other tools he developed for studying price movement. TradingView: RSI background
How traders use it
- Describe whether recent momentum is relatively strong or weak.
- Look for a possible momentum shift when price and RSI move in different directions (divergence).
- In a clear trend, watch for RSI to hold a stronger or weaker range instead of treating 70 and 30 as fixed turning points.
A simple trend-pullback study
This is a study framework for learning and backtesting, not a trade recommendation.
- First identify the broader direction from price structure or a longer moving average.
- In an uptrend, wait for RSI to cool during a pullback, then look for price and RSI to turn up again. In a downtrend, study the reverse pattern.
- Write down the price level that would invalidate the idea and set a risk limit before considering a trade. Invalidation means a price level where the original idea would no longer make sense. Test the rule on past data before using it.
Common mistakes and limits
- RSI can stay above 70 or below 30 for a long time in a strong trend.
- Divergence can appear early and price can continue in its original direction.
- The common 14-period setting is a convention, not a rule that fits every market or timeframe.
Indicators are based on past data and can give late or false signals. The examples on this page are educational, not current market signals or personal financial advice. Trading involves risk, including the possible loss of capital.
Frequently asked questions
Does RSI above 70 mean I should sell?
No. It means recent momentum is high by that calculation. Strong trends can keep RSI elevated.
What is a common RSI setting?
Many charting tools use 14 periods by default. Traders may study other settings, but shorter settings usually react faster and can be noisier.