
MACD: Moving Average Convergence Divergence
MACD compares two exponential moving averages to show how short-term momentum relates to a longer-term trend. It is useful for studying momentum changes, but it can react after price has already moved.
MACD compares two exponential moving averages to show how short-term momentum relates to a longer-term trend. It is useful for studying momentum changes, but it can react after price has already moved.
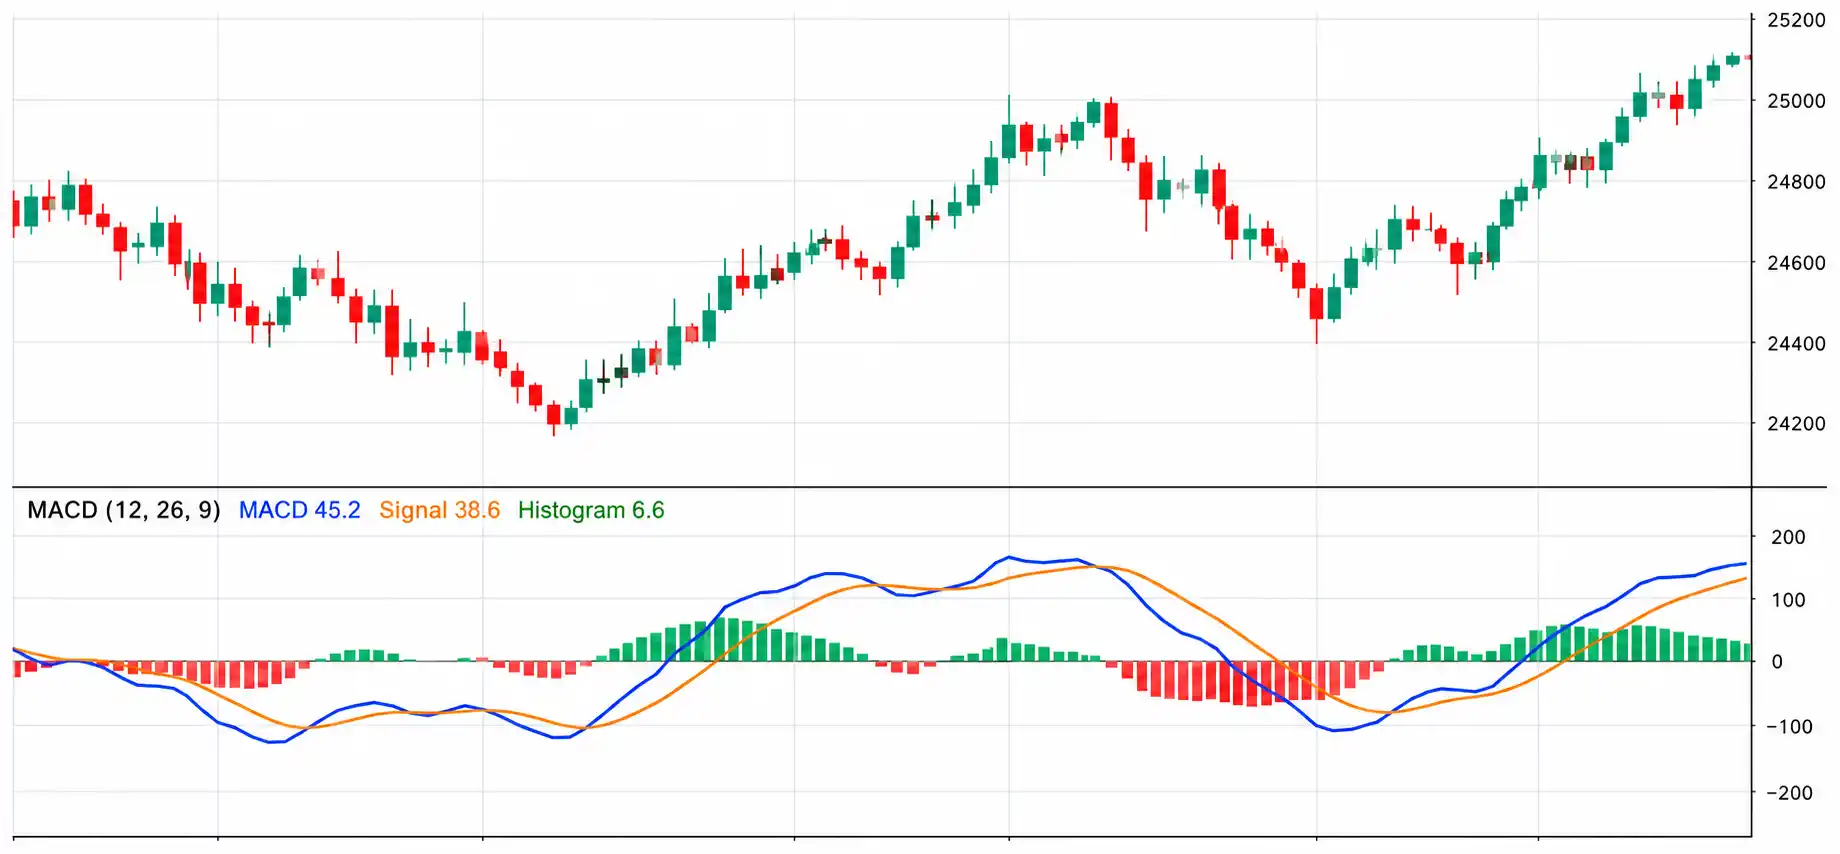
What it measures
The MACD line is usually the 12-period EMA minus the 26-period EMA. A 9-period EMA of the MACD line is called the signal line. The histogram shows the gap between those two lines. These are common default settings, not universal best settings.
A short history
Technical analyst Gerald Appel developed MACD in the late 1970s. It made moving-average relationships easier to study as a single line, a signal line and, in many modern charts, a histogram. CMT Association: Gerald Appel
How traders use it
- Study whether short-term momentum is strengthening or weakening.
- Observe MACD and signal-line crossovers as possible changes in momentum, then check price context.
- Use the zero line to see whether the shorter average is above or below the longer average.
A crossover with trend context
This is a study framework for learning and backtesting, not a trade recommendation.
- Choose a timeframe and define the market direction using price structure or a longer-term average.
- In an uptrend, study a MACD line crossing above its signal line, especially if the histogram also turns upward. A cross below can be studied in a downtrend.
- Decide in advance what price level would show the idea is wrong and how much risk is acceptable. A crossover alone is not an entry instruction.
Common mistakes and limits
- MACD is based on moving averages, so it is a lagging tool.
- Frequent crosses in a sideways market can produce repeated false starts.
- Divergence is a warning to investigate, not proof that a reversal will happen.
Indicators are based on past data and can give late or false signals. The examples on this page are educational, not current market signals or personal financial advice. Trading involves risk, including the possible loss of capital.
Frequently asked questions
What does a MACD crossover show?
It shows that the MACD line crossed its signal line. It can mark a momentum change, but it may arrive late or fail.
What does the MACD histogram show?
It displays the distance between the MACD line and signal line. Growing bars show that this gap is widening, not that price must continue.