
Bollinger Bands
Bollinger Bands place an upper and lower band around a moving average. The bands widen when recent price volatility rises and narrow when it falls. A band touch is not automatically a reversal signal.
Bollinger Bands place an upper and lower band around a moving average. The bands widen when recent price volatility rises and narrow when it falls. A band touch is not automatically a reversal signal.
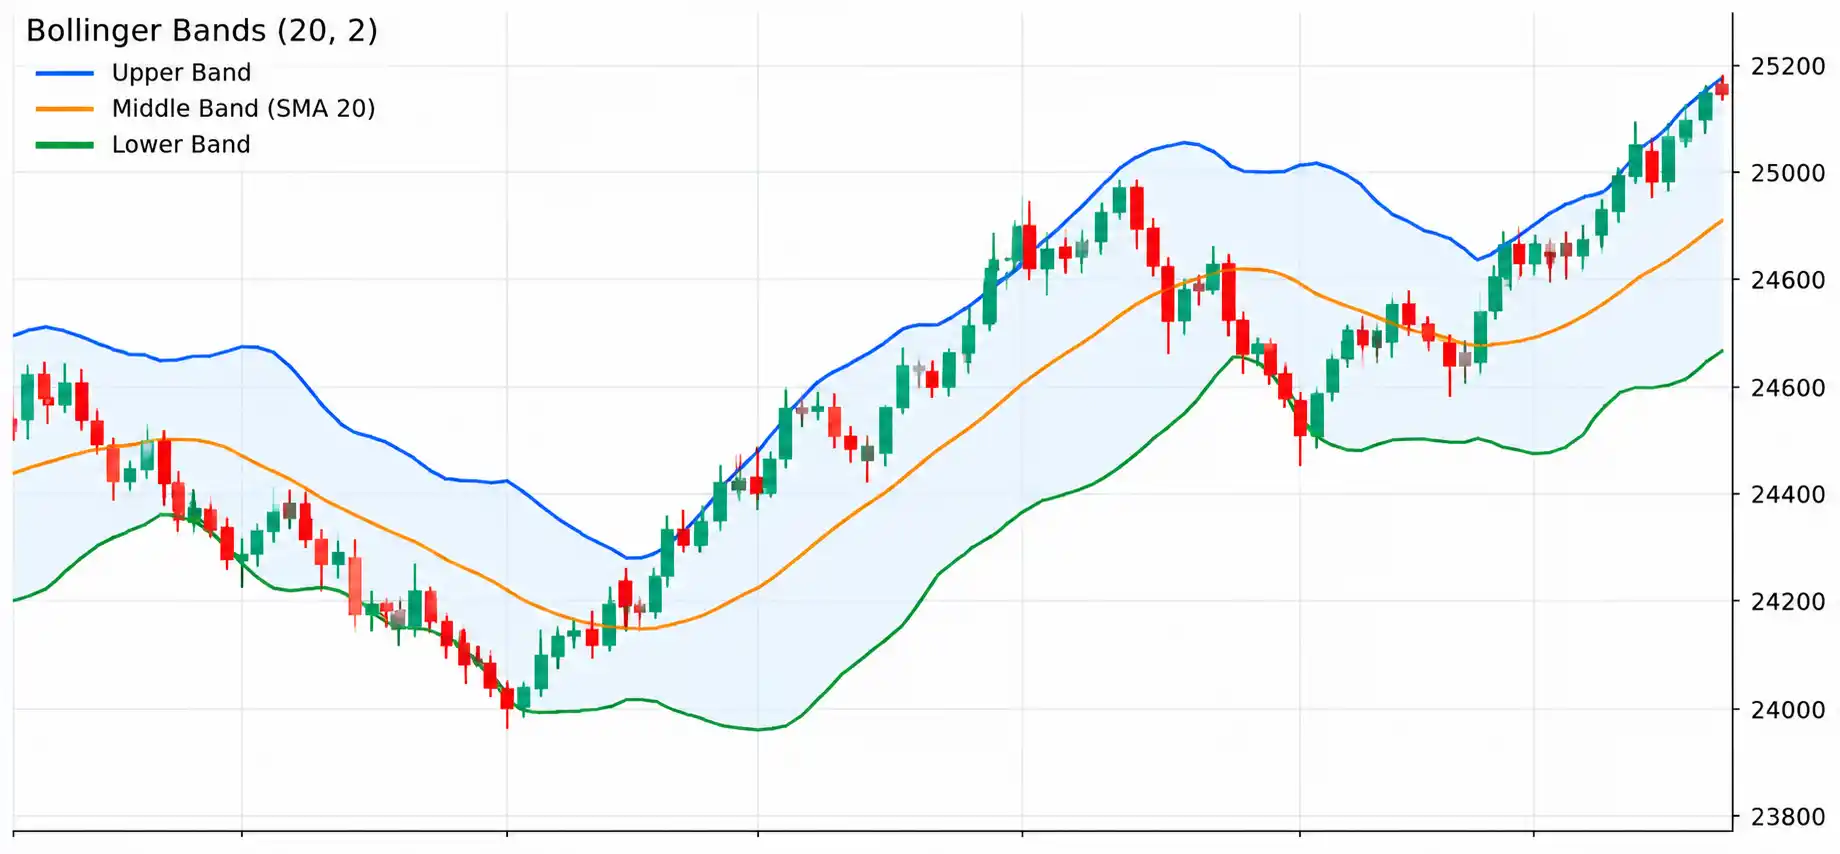
What it measures
The middle band is commonly a 20-period simple moving average. The outer bands are often placed two standard deviations above and below it. These are familiar defaults; different instruments and settings can behave differently.
A short history
John Bollinger developed Bollinger Bands in the early 1980s. The design adapted to changing volatility, unlike fixed-percentage bands that stay the same distance from a moving average. John Bollinger’s official site
How traders use it
- See whether volatility is expanding or contracting.
- Compare price with its recent range rather than interpreting one price level in isolation.
- Study a period of narrow bands as a possible sign that volatility has become quiet; expansion can follow, but direction is unknown.
A squeeze-and-confirmation study
This is a study framework for learning and backtesting, not a trade recommendation.
- Look for an unusually narrow band width compared with that instrument’s own recent history. This is sometimes called a squeeze.
- Do not guess the direction. Wait for a clear close outside the recent range and check whether broader price structure supports the move.
- Define what would count as a failed move, account for volatility and set risk before considering any trade.
Common mistakes and limits
- Price can walk along an outer band during a strong trend.
- A narrow band does not say whether the next move will be up or down.
- Standard-deviation bands describe recent data; they do not mark guaranteed support or resistance.
Indicators are based on past data and can give late or false signals. The examples on this page are educational, not current market signals or personal financial advice. Trading involves risk, including the possible loss of capital.
Frequently asked questions
What does it mean when Bollinger Bands narrow?
Recent volatility has fallen relative to the selected window. It does not reveal the direction of a future move.
Should I sell when price touches the upper band?
Not automatically. Price can stay near the upper band in a strong uptrend. Use trend context and a tested plan.