
Moving Averages: SMA and EMA
A moving average smooths past prices into a single line. It can help describe direction and provide a consistent reference for trend analysis, while hiding some short-term detail.
A moving average smooths past prices into a single line. It can help describe direction and provide a consistent reference for trend analysis, while hiding some short-term detail.
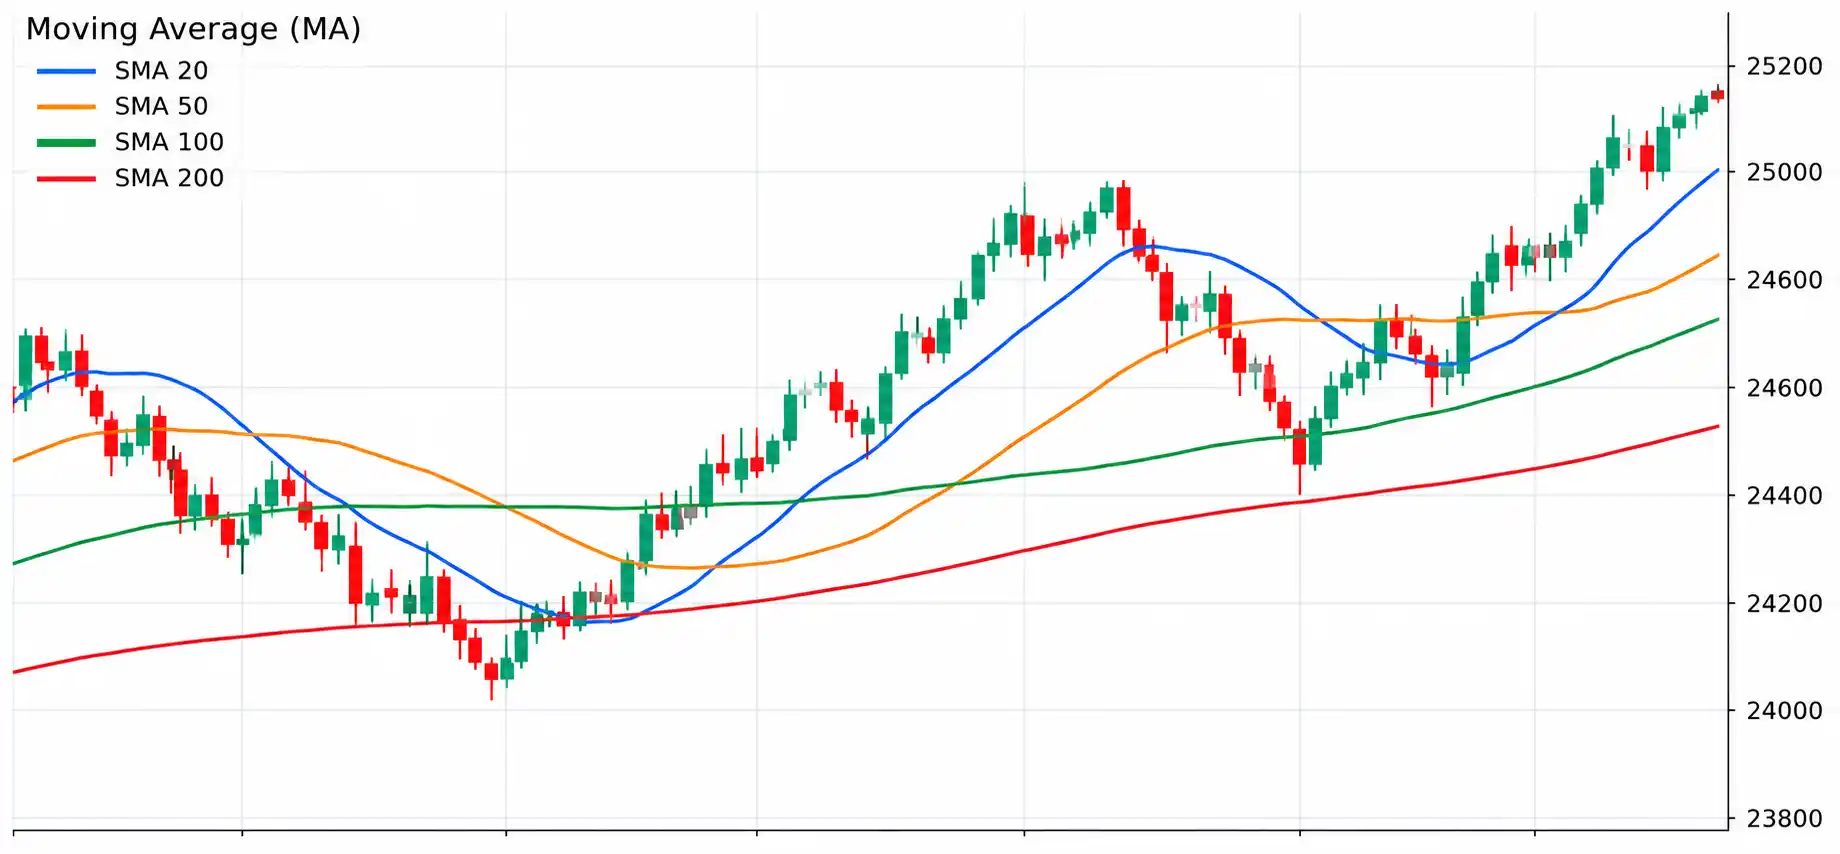
What it measures
A simple moving average (SMA) gives each price in its window equal weight. An exponential moving average (EMA) gives more weight to recent prices, so it usually reacts faster. Common chart examples include 20, 50 and 200 periods, but period length should match the question and timeframe.
A short history
A moving average is a long-established mathematical smoothing method rather than an indicator credited to one inventor. Traders have used average-price lines for generations; electronic charting later made it easy to compare many periods at once. CME Group: moving averages
How traders use it
- Describe whether average price is rising, falling or flat.
- Compare price with an average as one way to study trend context.
- Study two averages together to observe a possible trend change, while remembering that crossovers lag.
A two-average trend study
This is a study framework for learning and backtesting, not a trade recommendation.
- Select two periods before reviewing a chart, such as a faster and a slower average. Treat the choices as test settings, not recommendations.
- Study whether the faster line is above the slower line and whether both are sloping in the same direction.
- Wait for a price-based confirmation rule and define the price level that would show the idea is wrong and plan risk. Avoid relying on a crossover alone in a flat market.
Common mistakes and limits
- Every moving average is calculated from past prices, so it cannot lead price consistently.
- Short averages can change direction often; long averages can react very slowly.
- A price moving above or below an average does not guarantee that a new trend has started.
Indicators are based on past data and can give late or false signals. The examples on this page are educational, not current market signals or personal financial advice. Trading involves risk, including the possible loss of capital.
Frequently asked questions
What is the difference between SMA and EMA?
SMA weights all prices in its selected window equally. EMA puts more weight on recent prices and often responds faster.
Which moving-average period is best?
There is no single best period. Choose it for a defined purpose and timeframe, then test it without assuming it will work in the future.