
Technical indicators
Explore six popular indicators with clear explanations, short histories, original illustrations and basic strategy ideas for learning.
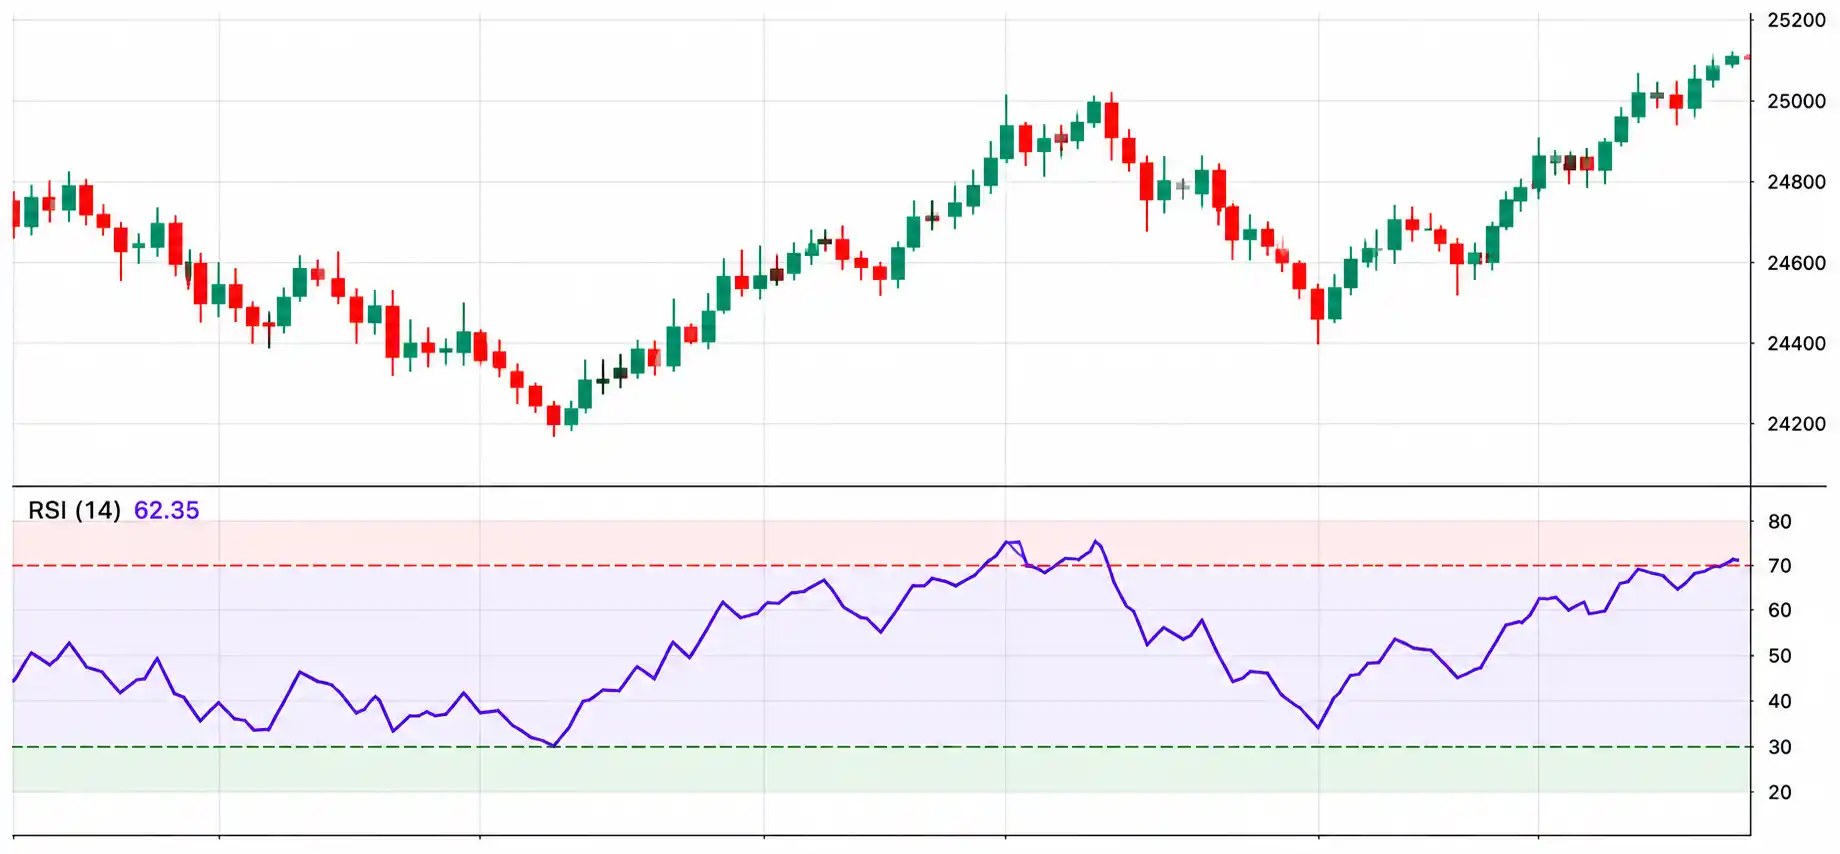 INDICATOR 01
Relative Strength Index (RSI)
A momentum tool that compares recent gains and losses. Learn why 70 and 30 are reference levels, not commands.
Read the easy guide →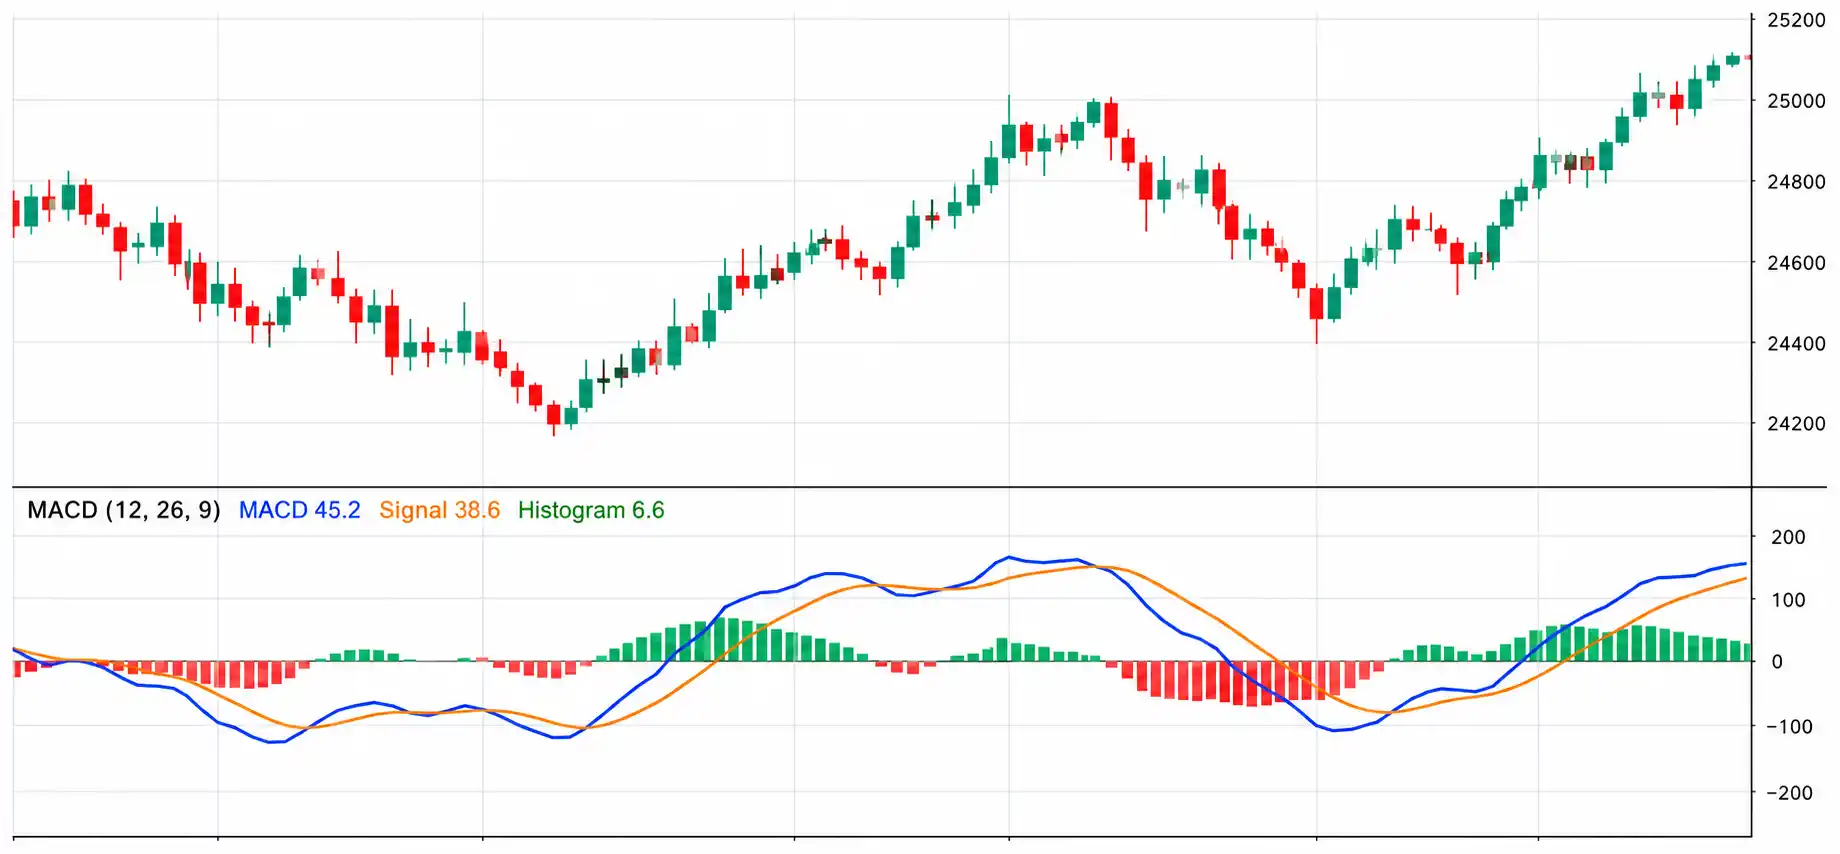 INDICATOR 02
MACD
Compare moving averages to study momentum shifts and possible trend changes.
Read the easy guide →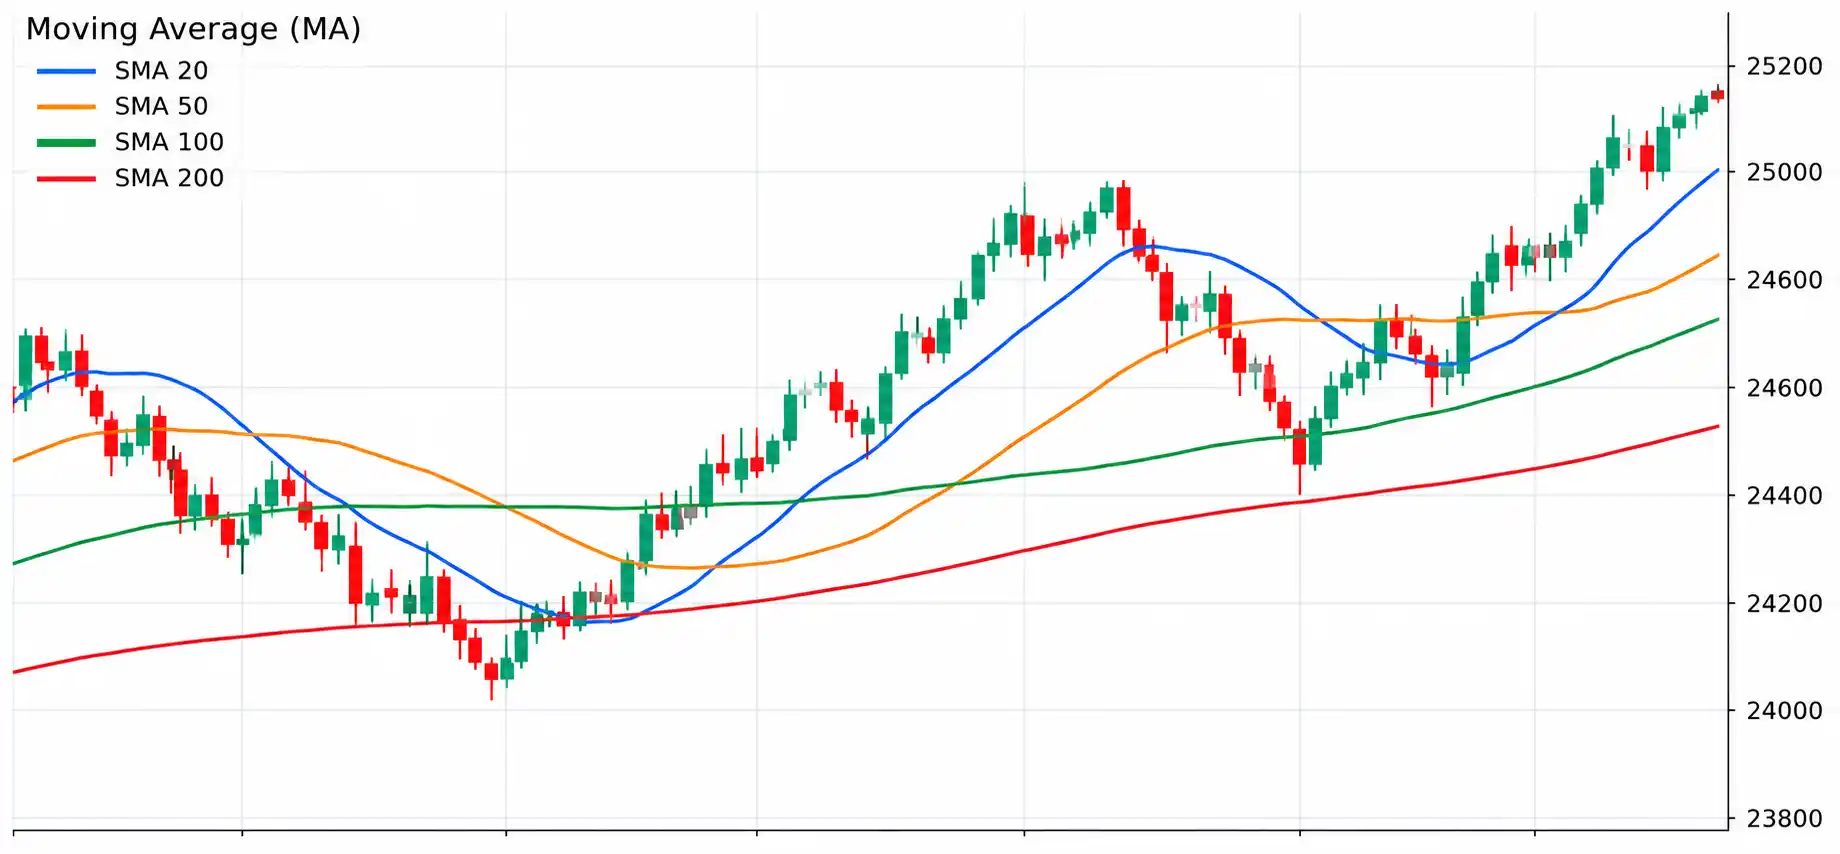 INDICATOR 03
Moving Averages: SMA and EMA
Smooth price data to study direction, trend context and crossovers.
Read the easy guide →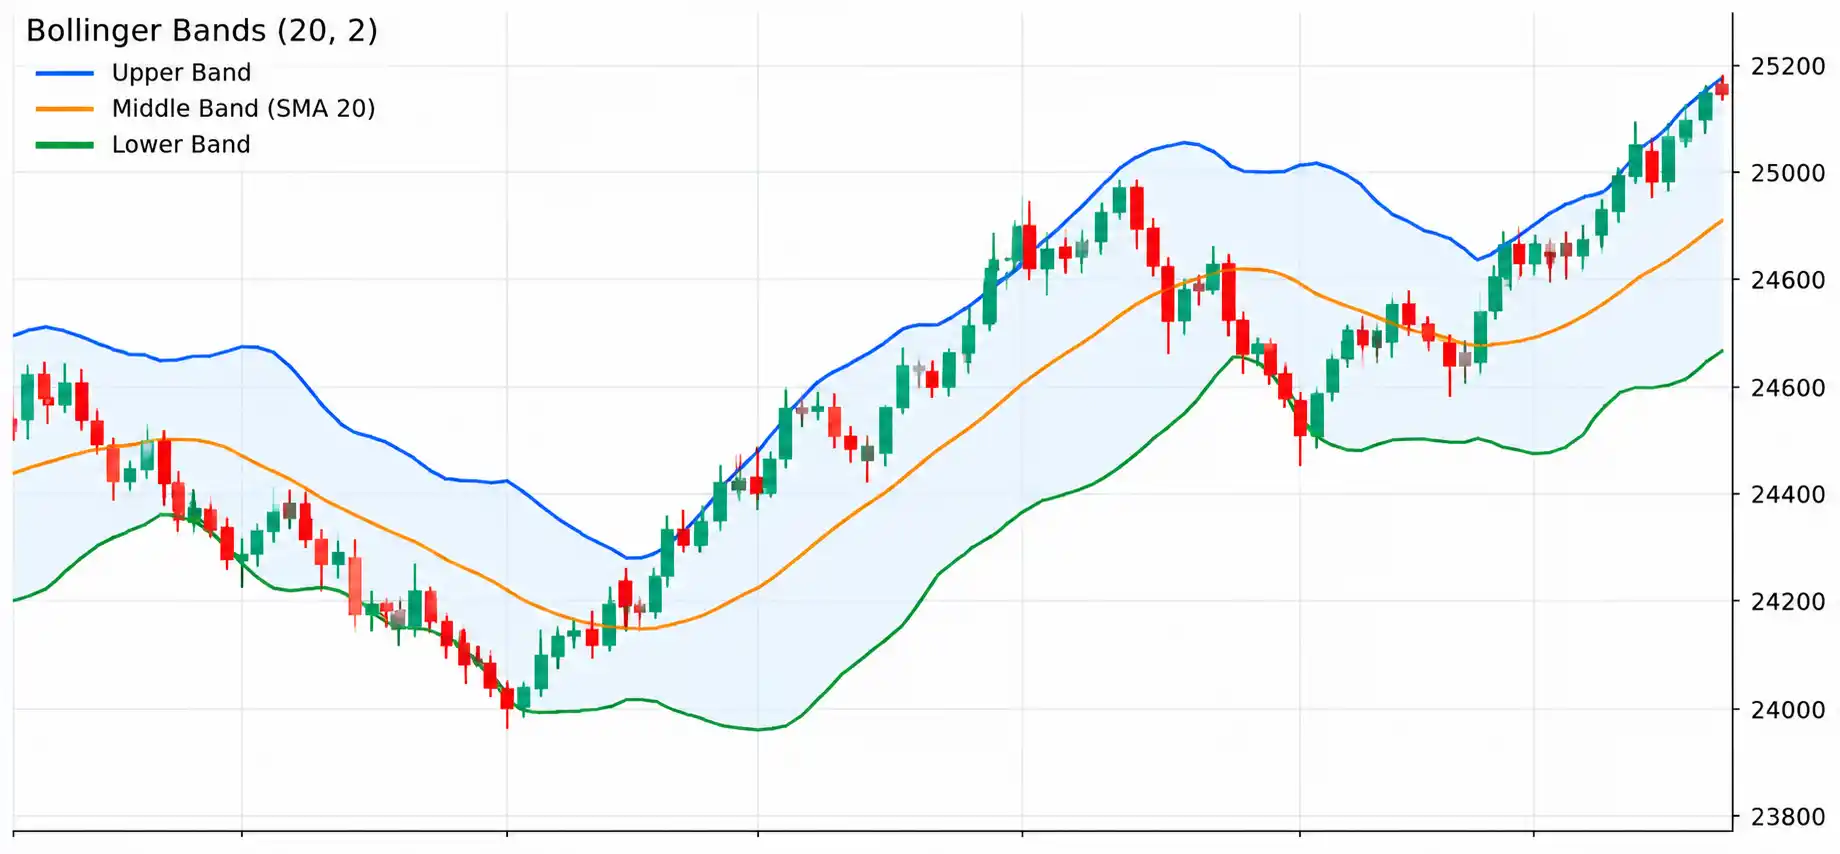 INDICATOR 04
Bollinger Bands
See how bands expand and contract as recent volatility changes.
Read the easy guide →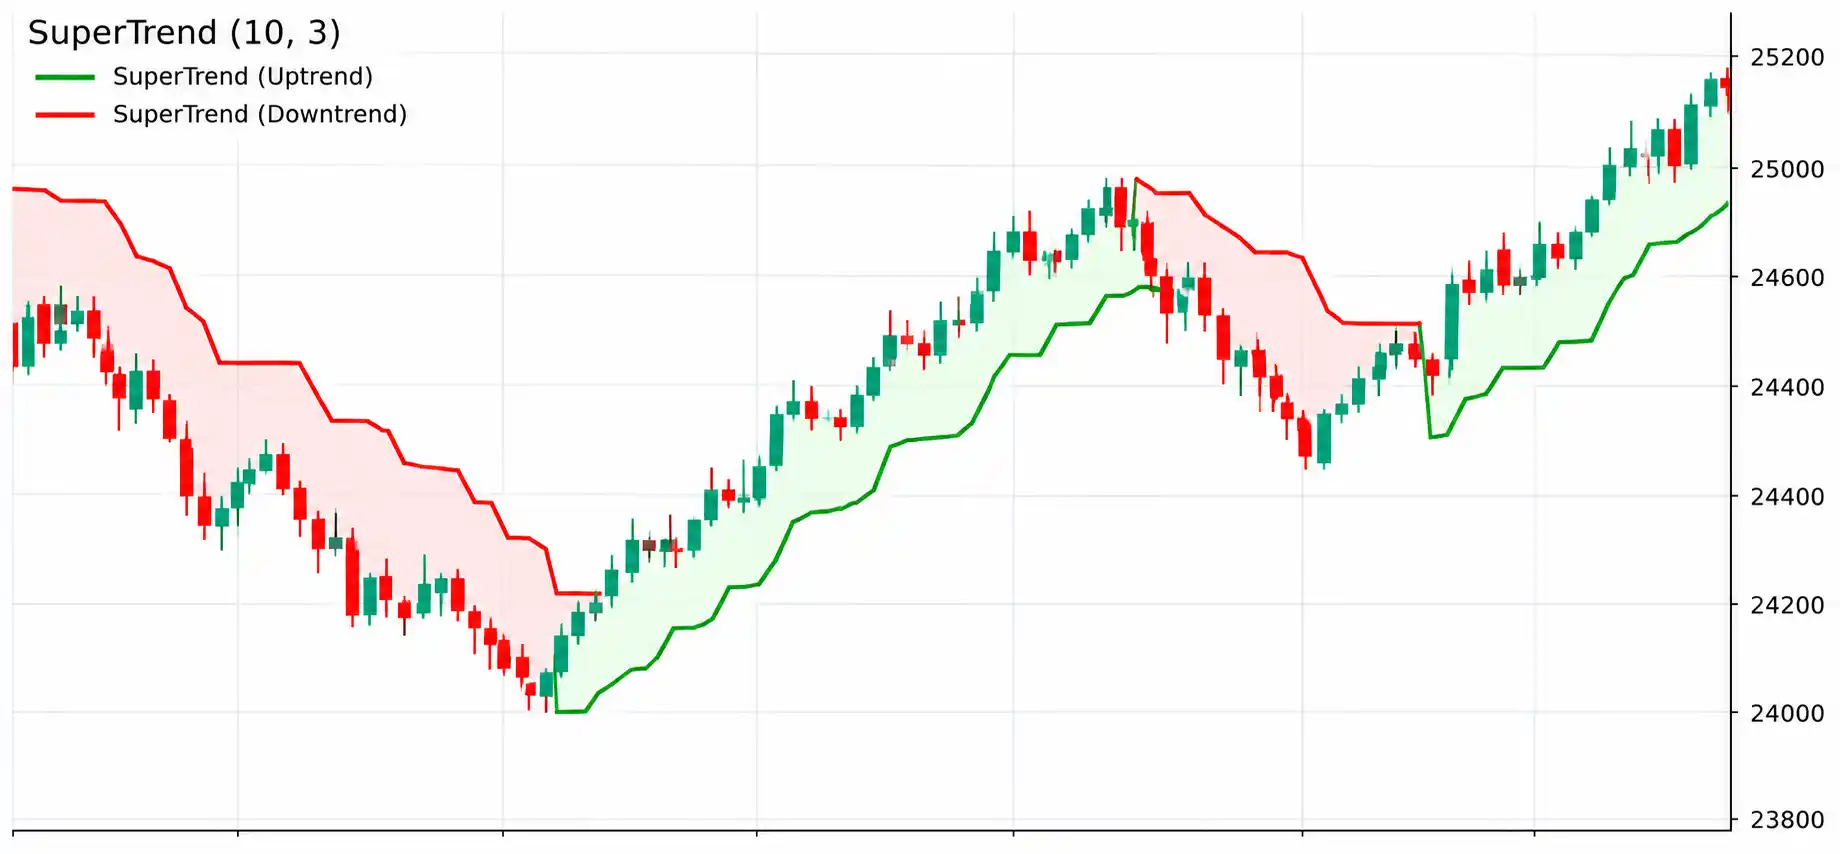 INDICATOR 05
Supertrend
Follow a volatility-based line that can help describe the direction of a trend.
Read the easy guide →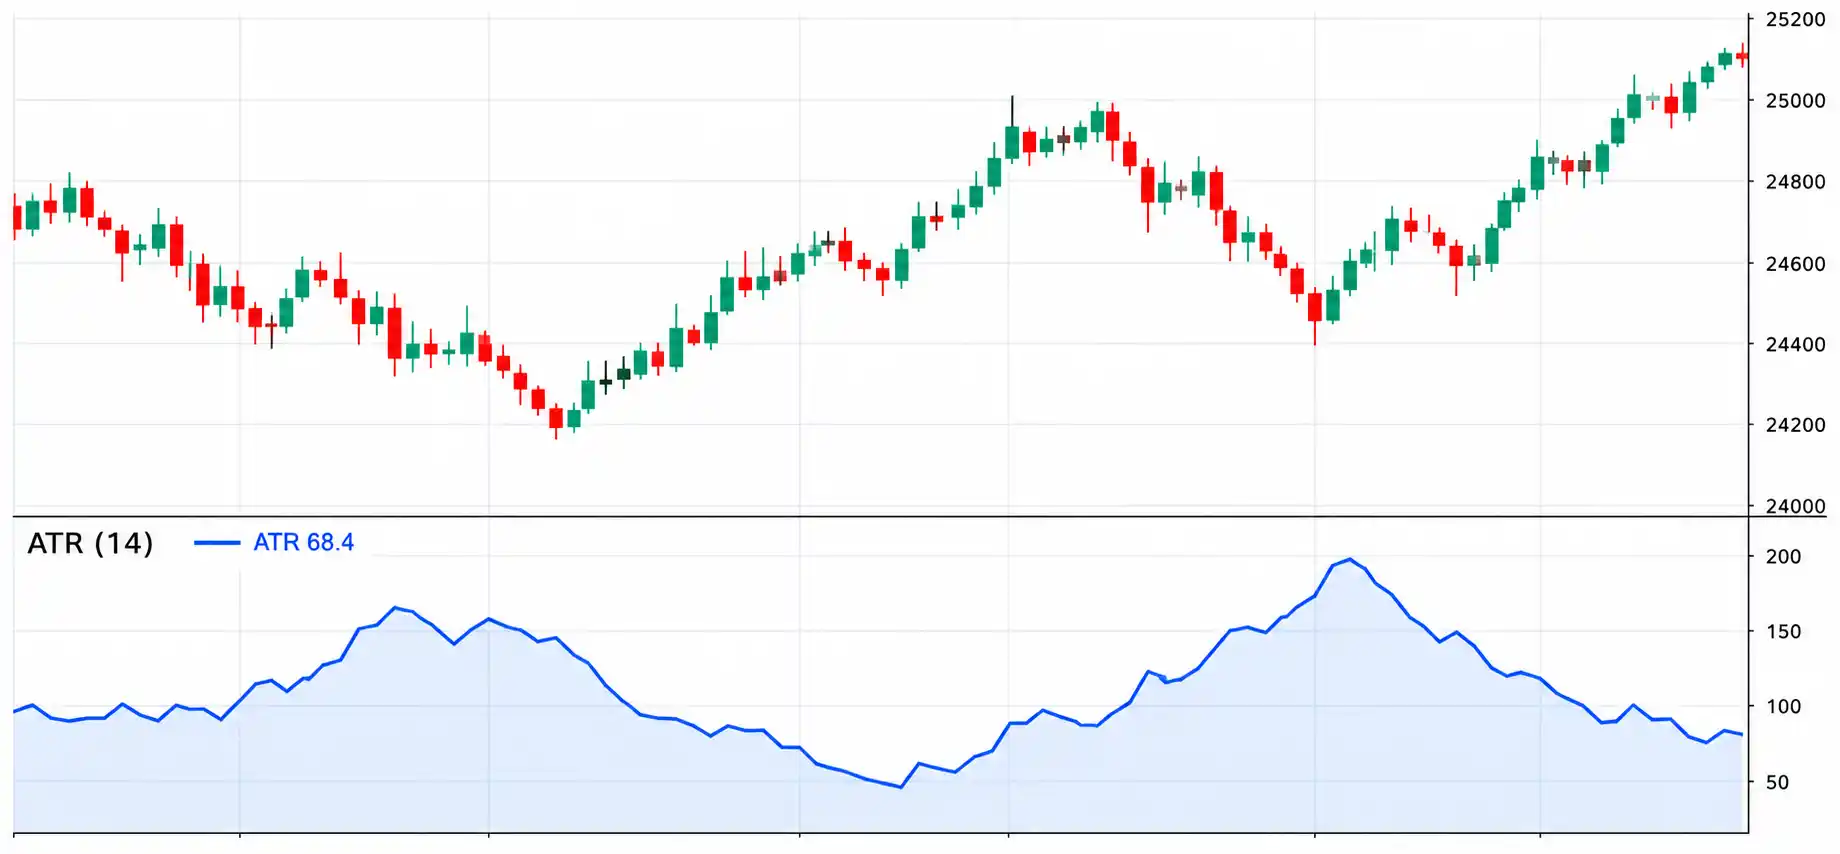 INDICATOR 06
Average True Range (ATR)
Measure recent movement size and learn how volatility can inform a risk plan.
Read the easy guide →They use historical price data and can lag or give false signals. Combine them with a defined plan and risk controls; do not rely on one indicator alone.